Submitted Report
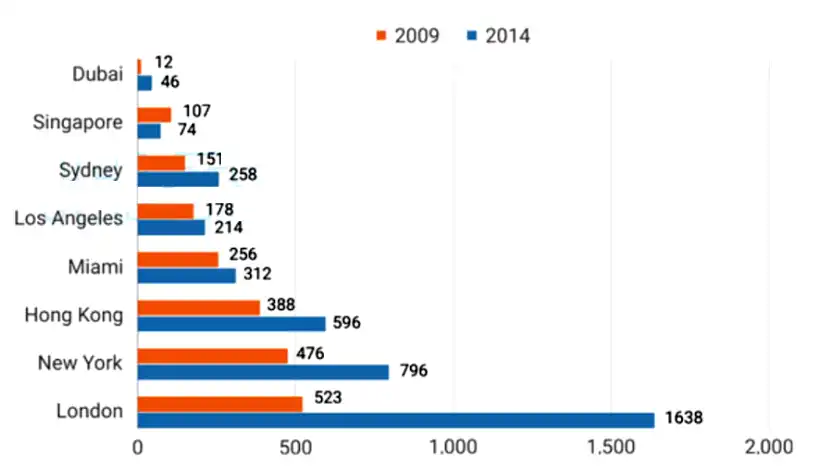
The provided bar chart presents a comprehensive comparison of the sales volume of houses valued higher than 5 million USD in eight major cities across the globe in 2009 and 2014.
Overall, the data clearly indicates a significant overall growth in the luxury real estate market during this time frame. However, there was one exception in Singapore, where the high-end property market experienced a slight decline.
To begin with, out of the eight cities, London accounted for the highest number of sales at 523 in 2009, which impressively increased to 1638 in 2014. This surge in transactions was also witnessed in New York, Hong Kong, and Miami, with their sales numbers rising from 476, 388, and 256 in 2009, to 796, 596, and 312 by the end of 2014 respectively.
Moving further, while Singapore saw a decrease in the sale of high-end properties, going from 107 to 74, cities like Los Angeles, Sydney, and Dubai witnessed a significant increase. Starting from relatively small numbers of 178, 151, and 12, these cities correspondingly witnessed a remarkable surge in sales reaching 214, 258, and 46.